An older Bitcoin roadmap from crypto commentator Klarck is getting a fresh look because the market has moved close to one of the key downside zones highlighted months earlier.
Loading Tweet…
TL;DR
- Klarck posted in February that BTC could bounce to $83,000, then gradually drop toward the $65,000–$55,000 zone.
- The post also projected a two-week accumulation phase before a later transition back to growth.
- Because the post is from February, it should be treated as a look-back on a market call, not fresh analysis.
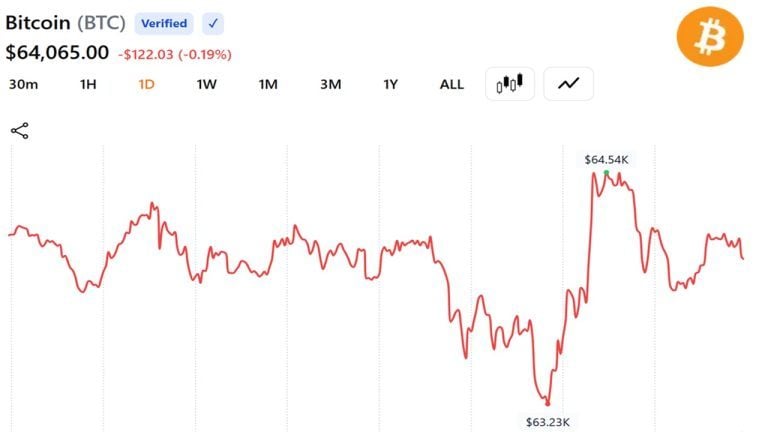
- The current relevance is that BTC has been trading near the upper end of the predicted downside zone.
An Older Bitcoin Roadmap Gets A Fresh Read
In February, X user Klarck posted a Bitcoin roadmap that called for a bounce toward $83,000, a gradual drop to the $65,000–$55,000 region, a two-week accumulation phase, and then a later transition back into growth. The same post ultimately projected $140,000 per BTC.
The post is not fresh market commentary. That matters. It should not be treated as a new signal or a current analyst update. Its relevance comes from the fact that Bitcoin has since moved close to the upper end of the downside range mentioned in the roadmap.
That makes it a useful example of how traders revisit old cycle maps when price begins to validate part of the path. It does not mean the full prediction is correct, and it certainly does not guarantee the later upside target. But it does show why old technical roadmaps can re-enter market conversation when price catches up to them.
The $65K–$55K Zone Is The Important Part
The near-term focus is not the $140,000 target. It is the $65,000–$55,000 zone. A call for a decline into that region can look extreme when Bitcoin is trading far above it, but it becomes more relevant when price approaches the top of the range.
If Bitcoin stabilizes around this area, the roadmap’s accumulation phase becomes the next part to watch. That would require price to stop making lower lows, build a tighter range, and show signs that sellers are losing control.
If Bitcoin fails to hold the upper end of the zone, however, traders may begin watching whether the lower end near $55,000 becomes the next liquidity target.
Why Traders Should Be Careful With Old Forecasts
There is a clear danger in giving too much weight to an old post. Markets change, macro conditions shift, liquidity moves, and forecasts can look accurate for a while before breaking down completely.
The better way to use this kind of call is as a reference point, not a trading plan. It can help frame the levels the market is now testing, but it still needs confirmation from current price action.
For now, Klarck’s February roadmap is back in focus because Bitcoin is near the first major downside zone he described. Whether the rest of the path plays out is still very much an open question.
This article was written by the News Desk and edited by Samuel Rae.
This article is based on public commentary shared on X by Klarck, available at at the source

You can get bonuses upto $100 FREE BONUS when you:
💰 Install these recommended apps:
💲 SocialGood - 100% Crypto Back on Everyday Shopping
💲 xPortal - The DeFi For The Next Billion
💲 CryptoTab Browser - Lightweight, fast, and ready to mine!
💰 Register on these recommended exchanges:
🟡 Binance🟡 Bitfinex🟡 Bitmart🟡 Bittrex🟡 Bitget
🟡 CoinEx🟡 Crypto.com🟡 Gate.io🟡 Huobi🟡 Kucoin.


Comments