Ethereum is trading below $1,700 as the market faces a key test that will determine whether the current level holds as support or gives way to further deterioration. The price has already dropped approximately 28% from recent levels — and a CryptoQuant analyst has identified a development in the derivatives data that places the current weakness in a structural context that extends well beyond short-term price action.
The most significant signal is not the price decline itself but the way Open Interest has reset across major exchanges during the decline. The derivatives positioning that accumulated throughout 2025 and into 2026 is unwinding — and the scale of that unwind has now returned multiple venues to levels last seen in April 2025, effectively erasing more than a year of leveraged exposure in a compressed timeframe.
On Gate.io, ETH Open Interest has fallen from $4.84 billion on May 7 to $2.68 billion on June 9 — a reduction of approximately $2.16 billion, or roughly 45%, in just over one month. The current reading almost exactly matches the $2.67 billion recorded on April 11, 2025. Bybit shows an identical pattern, with Open Interest near $805 million — virtually matching the $795 million level from April 9, 2025.
Two major exchanges have returned to April 2025 market structure simultaneously. The leverage built across the entire subsequent period has been cleared. Binance funding rates turning negative confirm that the remaining futures activity is not expressing bullish conviction — it is expressing uncertainty at best and mild bearish bias at worst.
The Funding Tells the Real Story
The CryptoQuant analysis identifies the asymmetry between venues as the detail that prevents the Open Interest reset from being read as a clean structural clearing. Gate.io and Bybit have both returned to April 2025 levels — the leverage accumulated across more than a year of market activity was erased in weeks. Binance has not followed the same path. ETH Open Interest on Binance remains around $2.76 billion, staying close to its higher range, while the other major venues have contracted sharply around it.
The retained Binance positioning does not automatically signal bullish intent to remain in the market. The funding rate tells a more accurate story. At approximately -0.0038, Binance funding has turned negative again — traders are not paying a premium to hold long exposure. The Open Interest is present, but the conviction behind it has shifted from directional to defensive.

That combination creates the specific market message the report identifies. The derivatives reset is real but uneven — some exchanges have cleared their leverage fully while Binance retains positioning under a funding backdrop that reflects caution rather than confidence. Negative funding during a price decline describes one of three conditions: defensive positioning from participants hedging existing exposure, short pressure from traders betting against recovery, or simply the absence of aggressive long conviction from participants who might otherwise be paying to hold bullish exposure.
None of those three conditions describes a market preparing to rally. Together, they describe a derivatives structure that has partially reset while the most important venue holds residual positioning without the directional commitment that would make that positioning constructive.
Ethereum Breaks February Lows — Can Bulls Defend The Last Major Weekly Support?Ethereum is trading near $1,670 after suffering one of its most severe weekly breakdowns of the cycle, with price now falling below the February lows and reaching levels not seen since early 2023. The move is significant because it invalidates the broad trading range that contained ETH for most of 2026 and confirms a continuation of the bearish structure that has been developing since the rejection from the $4,800 cycle peak.
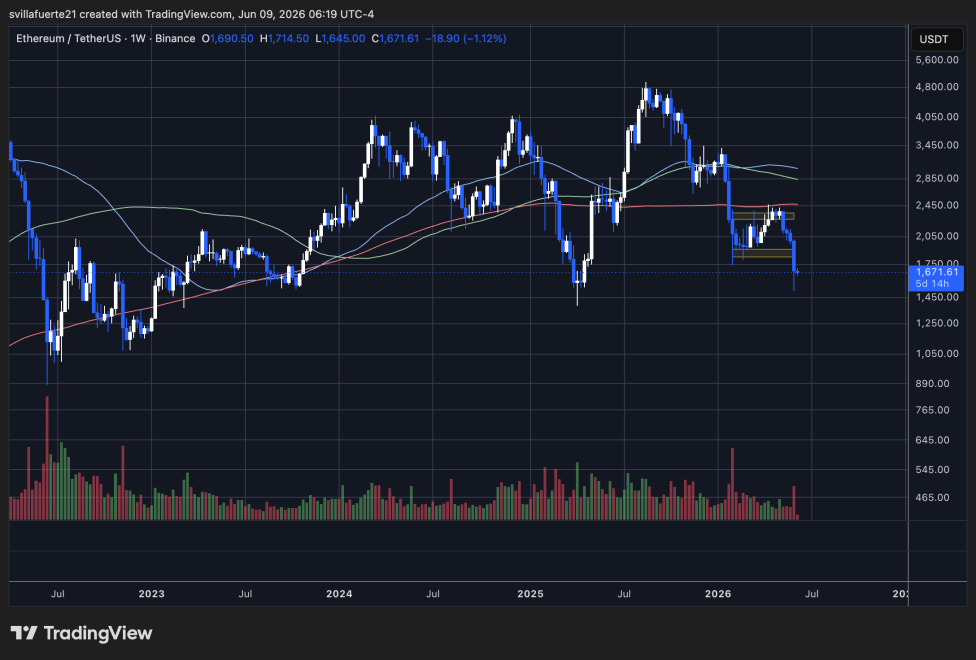
From a market structure perspective, the chart is defined by a clear sequence of lower highs and lower lows. After failing to hold above the $2,250-$2,350 resistance zone, Ethereum lost the critical $1,800 support area that previously acted as the floor of the February-March consolidation. That breakdown triggered a rapid move toward the $1,500 region, where buyers finally stepped in to prevent a deeper collapse.
The most important detail is that ETH is now trading below all major weekly moving averages. The 50-week, 100-week, and 200-week moving averages are clustered far above the current price, reinforcing the strength of the prevailing downtrend and creating significant resistance overhead.
The recent low near $1,500 now represents the most important support level on the chart. If buyers can defend that area, Ethereum could attempt to build a base and recover toward $1,800. However, a weekly close below the recent lows would expose the market to a deeper retracement toward the $1,300-$1,400 region, extending the correction and confirming further deterioration in long-term market structure.
Featured image from ChatGPT, chart from TradingView.com

You can get bonuses upto $100 FREE BONUS when you:
💰 Install these recommended apps:
💲 SocialGood - 100% Crypto Back on Everyday Shopping
💲 xPortal - The DeFi For The Next Billion
💲 CryptoTab Browser - Lightweight, fast, and ready to mine!
💰 Register on these recommended exchanges:
🟡 Binance🟡 Bitfinex🟡 Bitmart🟡 Bittrex🟡 Bitget
🟡 CoinEx🟡 Crypto.com🟡 Gate.io🟡 Huobi🟡 Kucoin.


Comments