
Ethereum is struggling to stay above $2,100 as the market shows indecision that has left bulls and bears in a standoff without a clear resolution. A brief recovery arrived when President Trump stated that the Strait of Hormuz would be opened following talks with Middle Eastern leaders about Iran and regional peace efforts — markets interpreted the comments as a potential easing of geopolitical tensions, and both Bitcoin and Ethereum rebounded in response. The relief was real but short-lived.
XWIN Research Japan has examined Ethereum’s internal market structure during the recovery and found something that complicates the straightforward interpretation of the recent price weakness considerably. The data that normally identifies a healthy market is present. Spot Taker CVD remains positive — buyers are still outpacing sellers in the order flow. Funding rates are still above zero — derivatives participants are paying to stay long rather than paying to stay short. Exchange Netflow shows ETH continuing to leave exchanges — coins moving into self-custody rather than toward the sell side.
By every conventional bullish signal, Ethereum should not be trading where it is. The asset fell from approximately $2,375 on May 11 to nearly $2,031 on May 23 — a 14% decline that occurred while every internal market indicator was pointing in the opposite direction.
XWIN Research Japan’s analysis identifies the force that explains the contradiction — and it is not visible in any of the metrics that have been signaling strength.
Hidden Sellers, Macro Headwinds and a Market That Looks Strong but Keeps Falling
The XWIN Research Japan report identifies the mechanism behind the contradiction with precision. Hidden liquidity is the structural explanation for how positive CVD, positive funding, and exchange outflows can coexist with a falling price. Large sell orders placed by market makers and whales sit in the order book absorbing aggressive buying without announcing themselves in the metrics that retail participants monitor.
The surface signals look bullish because the buyers are genuinely present. The price falls because the sellers are larger, more patient, and invisible to conventional flow analysis.

The macro environment compounds the structural pressure. Despite the CLARITY Act initially improving sentiment around digital assets, markets have quickly refocused on inflation risks and the higher-for-longer interest rate environment that continues to define Federal Reserve policy. For a high-beta asset like Ethereum — which amplifies both upside and downside moves relative to broader risk sentiment — that macro backdrop remains a persistent headwind that no amount of on-chain improvement can fully neutralize while it persists.
The derivatives picture adds the final layer. Healthy bullish trends require rising open interest, stable funding, and expanding long positioning simultaneously. What the current data shows instead is short covering and deleveraging, driving recent price bounces — mechanical moves rather than genuine demand returning to build new directional exposure.
Technically, Ethereum is approaching support zones at approximately $1,984 and $1,937 — levels that the report identifies as potentially significant if macro conditions stabilize and real spot demand returns. At those prices, the asset could eventually be viewed as genuinely undervalued relative to its network fundamentals. Whether that reassessment arrives before a test of deeper levels depends entirely on whether the hidden selling pressure exhausts itself before the technical support does.
Ethereum Faces Critical Support Test
Ethereum continues to trade in a fragile structure as price struggles to reclaim the key resistance zone between $2,250 and $2,350. After briefly recovering into that supply area earlier this month, ETH faced repeated rejections that triggered a steady decline back toward the $2,100 region. The chart now shows a market trapped between weakening bullish momentum and critical support levels that buyers must defend to avoid a deeper retrace.
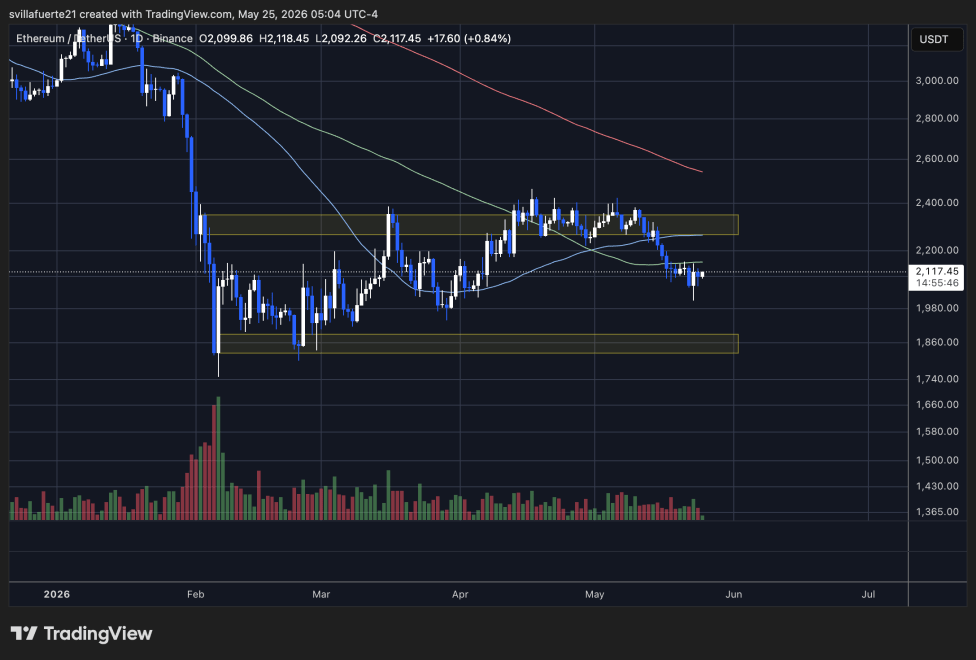
Technically, ETH is trading directly around the 50-day moving average, which has flattened after weeks of recovery. This level is acting as immediate short-term support, but the inability to establish acceptance above the 100-day moving average near $2,250 reflects continued weakness in broader market momentum. Meanwhile, the 200-day moving average remains far above current price action and continues sloping downward, confirming that Ethereum has not yet transitioned back into a confirmed macro bullish trend.
The highlighted resistance zone around $2,300 has become structurally important. Every attempt to break above it has been absorbed by sellers, creating a sequence of lower highs that now pressures the market toward the lower support range between $1,820 and $1,880.
Volume has also declined during the recent pullback, suggesting uncertainty rather than panic-driven capitulation. However, if ETH loses the $2,080–$2,100 region decisively, selling pressure could accelerate quickly toward the February demand zone.
Featured image from ChatGPT, chart from TradingView.com

You can get bonuses upto $100 FREE BONUS when you:
💰 Install these recommended apps:
💲 SocialGood - 100% Crypto Back on Everyday Shopping
💲 xPortal - The DeFi For The Next Billion
💲 CryptoTab Browser - Lightweight, fast, and ready to mine!
💰 Register on these recommended exchanges:
🟡 Binance🟡 Bitfinex🟡 Bitmart🟡 Bittrex🟡 Bitget
🟡 CoinEx🟡 Crypto.com🟡 Gate.io🟡 Huobi🟡 Kucoin.

















Comments